Chapter 5: Why do your graphs lie to you?
This chapter will explain why, in poker and especially in Spins, you should be wary of appearances.

Gandalf
Professional Spin & Go player, co-founder of Poker Sciences
Sometimes your CEV is reassuring, your bankroll less so.
Deceiving appearances
You now have a solid understanding of Spin structure, rake, CEV, and you feel ready to get started.
You play for two weeks and then, this happens:
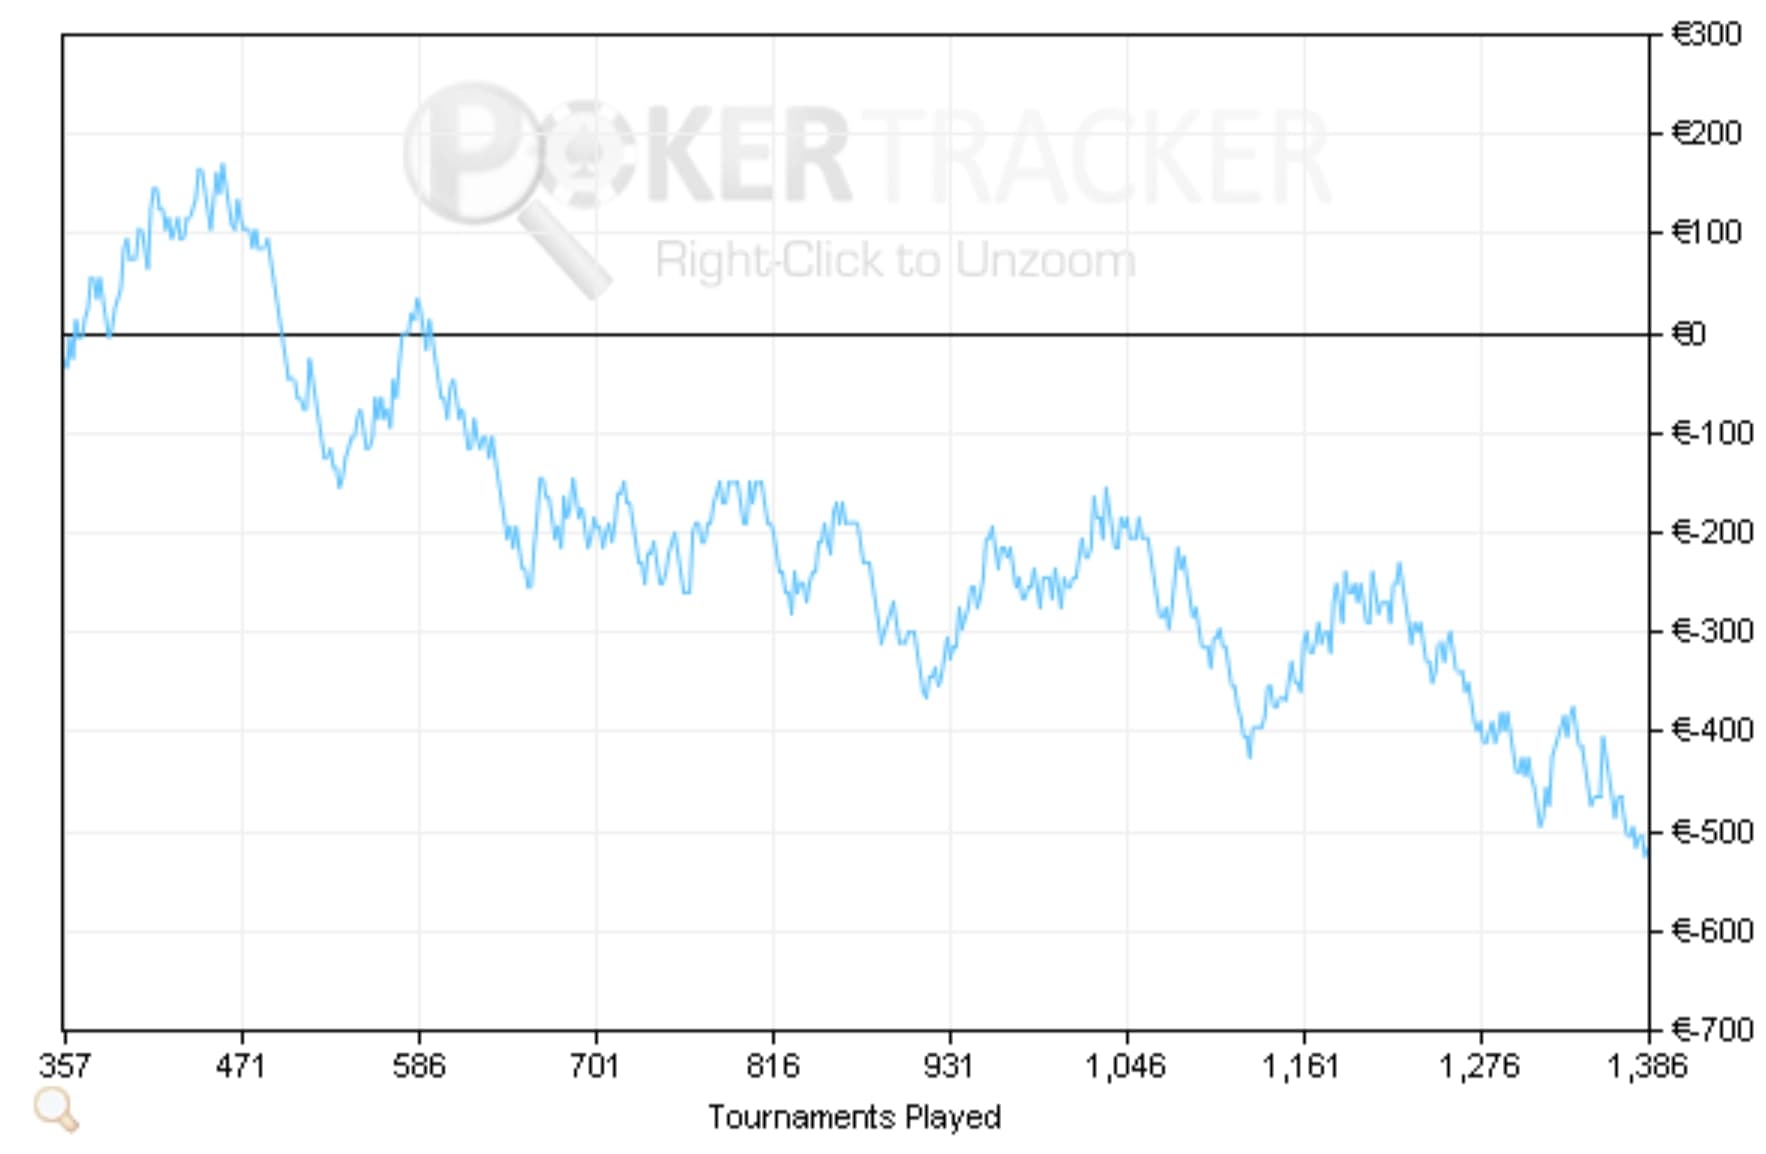
Ouch, your poker budget is going up in smoke. Over €500 lost in 1,400 Spins... Did Poker Sciences mislead you?
Quick spoiler: this graph is an excerpt from a series of games I played in 2021, at the €10 level, with a CEV above 60. This shows how real this situation is and that it can happen to you even if you're a winning player.
Of course, such a big downswing over more than a thousand games is rare, but it is possible.
But this graph is misleading, and for a simple reason: in poker, whether you play MTTs, Spins, or even Cash games, your short-term results don't necessarily reflect your true skill level. It's human to doubt, to want to adjust your game after a losing streak. Yet, the worst mistake would be to change a winning strategy simply because variance is playing tricks on you.
In Spin & Go, it's not uncommon to experience swings of 20 to 60 buy-ins, even when playing perfectly.
Remember what we saw in the previous chapter: because of variance, it takes more than a thousand games to get a relatively clear idea of your CEV and therefore your skill level.
Well, for your bankroll it's the same thing, even worse. Even if you're a good player, variance can make you lose (a lot) in the short term...
Three player profiles: The curve example
To better illustrate this phenomenon, let's now look at three player profiles through their results curves.
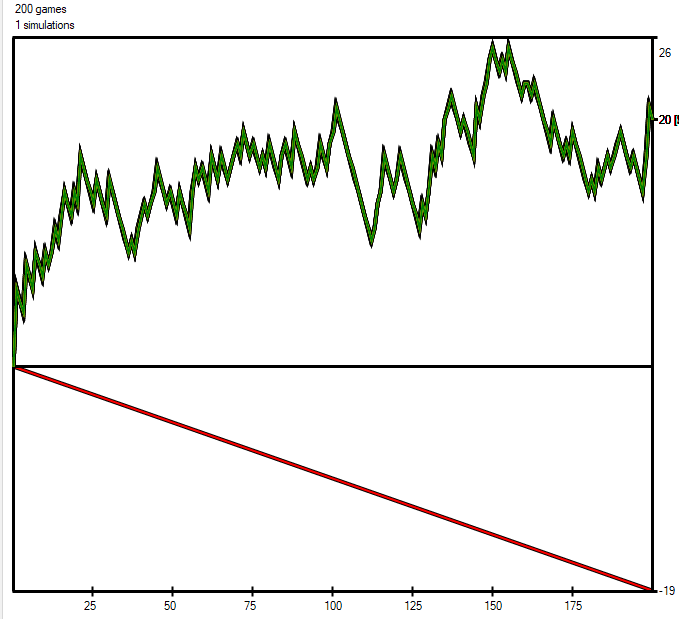
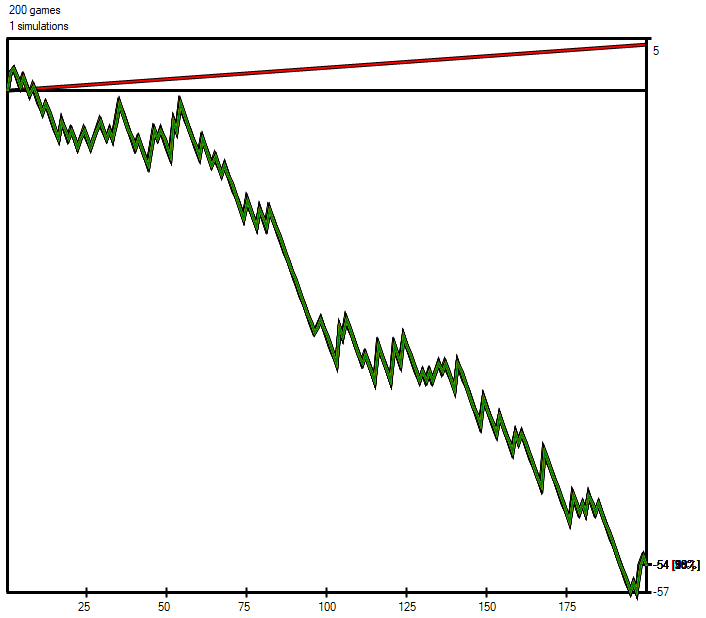
These curves simulate what 3 Spin players of different skill levels could experience over 200 games.
These simulations were done with Swongsim (you're getting used to it by now).
For each player profile, they give an example of what could happen in reality. With the red curve 🔴: the number of buy-ins the player should have won (or lost) and the green curve 🟢: what actually happened (due to variance).
They show how variance can create a false impression of success or failure: a winning player can go through a period of losses, while a losing player can temporarily show gains. These scenarios, as counterintuitive as they may seem, are very real and must be understood to avoid being fooled by variance.
1. The "losing" player
The "losing" player is the most common. This is what we call a "fish." This player often believes they're good, or at least that they have a decent level. Over a sample of 200 spins, they might appear to be "winning," but in the long run, their mistakes will catch up with them.
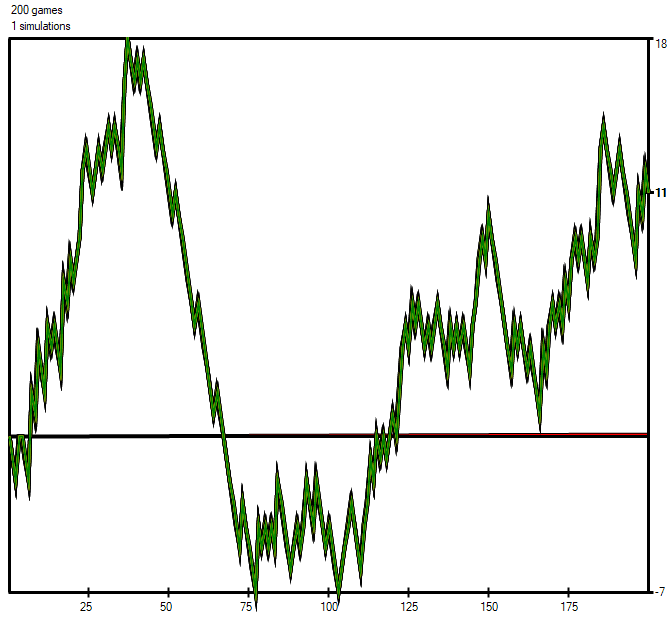
2. The "breakeven" player
The breakeven player has learned to play Spins correctly, but doesn't actively seek to improve. This is typically the case of a regular who knows the basics of Spins, but doesn't try to deepen their strategy (a "reg fish").
3. The "winning" player
The "winning" player is the one who knows how to play optimally, a true Spin regular. This type of player stands out by avoiding major mistakes and mastering game strategies. As you move up in stakes, these players become increasingly visible, particularly from the €5 level onwards, and even more so at €10 and €20.
However, even good players can end up with a very negative curve in the short term due to variance. This kind of variance is part of daily life for a Spin player.
The good news is that in the long run, they will always end up being profitable. Provided they manage to maintain a good level of play when they lose repeatedly (we'll talk more about "mental game" later) and they don't go "broke" (meaning they always maintain a positive bankroll, but we'll also discuss this aspect later).
Conclusion: In the short term, variance masks everything
What you need to remember for now is that in the short term, it is IMPOSSIBLE to judge a player's true profitability just by looking at their earnings curve.
This is actually a trap that many players fall into, thinking that their short-term losses or gains are directly linked to the quality of their play, when it's often simply volatility.
CEV is always a more reliable indicator than your bankroll, but as we saw in the previous chapter, even to know your CEV, a (very) large number of games is necessary.
So, can you grind Spins despite this variance?
Before addressing this question in detail in the next chapter, here's a preview of the continuation of the graph I showed you at the beginning of this chapter:

This graph perfectly illustrates the fact that over an extended period, even with variance, a player with a good skill level will always end up generating profits.